
With the government having announced 3,539 new coronavirus cases on Friday, 11th September - the highest figure since 17th May - an interactive map has been released showing where the new coronavirus cases have been recorded.
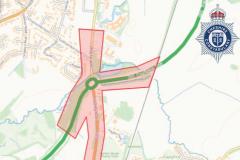
The map, produced by Public Health England, shows which neighbourhoods have been worst affected by the virus between September 1st and September 7th.
The map breaks down areas by 'middle super output areas' and highlights which ones have seen more than two confirmed Covid-19 cases during the first week in September.
The latest figures from Public Health England for our local area are:
• Alderley Edge and Chelford – seven
• Handforth and Dean Row – five
• Mobberley, Plumley and High Legh – five
• Wilmslow Town – four
• Lacey Green and Wilmslow Park - 0-2
• Fulshaw Park and Lindow - 0-2
• Prestbury and Adlington - 0-2


Comments
Here's what readers have had to say so far. Why not add your thoughts below.