
As the prime minister announced a 27-day national lockdown, which will come into effect just after midnight on Thursday, 5th November, the latest figures have been released showing the worse affected local areas.
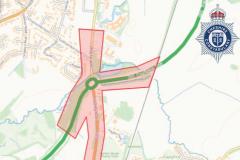
The map, produced by Public Health England, has been updated to show where the new coronavirus cases have been recorded during the 7 day period ending on October 26th.
The map breaks down areas by 'middle super output areas' and highlights that Fulshaw Park and Lindow is currently the worst affected area with an infection of 760.7 per 100,000 people.
These latest figures from Public Health England show the number of cases during the 7 day period and the infection rate per 100,000 people
• Alderley Edge and Chelford – 24 302 (-21.9%)
• Handforth and Dean Row – 40 368 (37.9%)
• Mobberley, Plumley and High Legh – 65 543.2 (132.1)
• Wilmslow Town – 13 185.4 (-40.9%)
• Lacey Green and Wilmslow Park - 14 212 (-26.)
• Fulshaw Park and Lindow - 55 760.7 (77.4%)
• Prestbury and Adlington - 20 391 (42.9%)
% = change from previous 7 day period.
During this seven day period, Cheshire East had 867 cases, which represents a 26.8% increase on the previous 7 days. The infection rate per 100,000 is 225.7.


Comments
Here's what readers have had to say so far. Why not add your thoughts below.
Destroying the economy isn't a solution to anything. It's just destroying the economy.